How we made a 13 GB LLM container cold-start in 40 seconds


A 13 GB GPT-OSS-20B inference container: 571s → 40.65s. A 2.4 GB Llama-3.2 container: 91s → 7.4s. Same hardware, same app, only the image format and snapshotter config changed.
The obvious first move — lazy loading — made things 66% slower. The biggest single win came from a stack of hidden config knobs we had to read the snapshotter's Go source to find. The last bottleneck wasn't in containerd at all; it was the AWS EBS default write ceiling.
If you ship LLM images and your cold start is over a minute, this is for you.
If you ship a multi-gigabyte ML container — Hugging Face weights baked in, PyTorch + transformers, a FastAPI server — and you've watched the deploy take five-plus minutes from docker run to first inference, this post is the playbook we wish we had.
We're talking specifically about large ML images: 2 GB to 20 GB, dominated by quantized model weights, served by Python. The advice here doesn't generalize to a 200 MB Go binary, and several of the fixes are actively wrong for source-code-heavy images. We'll flag those tradeoffs as we go.
This is also the honest version of the journey. We hit five separate bottlenecks. Each fix uncovered the next one. Several of our intuitions were wrong, including the first one we tried.
Why this matters for ML workloads specifically
Most container performance writeups assume your image is mostly unused at startup. That's true for MySQL, Redis, a Go service. It's not true for LLM containers.
A typical LLM image looks like this:
- Model weights: 2–20 GB, quantized, embedded directly in the image as a single big file (
.gguf,.safetensors). - Python interpreter + libraries: a few hundred MB. PyTorch, transformers, tokenizers, sentencepiece, FastAPI, uvicorn, and their transitive C extensions.
- Application code: ~MB.
Two properties make this image shape uniquely painful:
-
You read most of the bytes at startup. The model has to be in memory before the first inference. Python's import machinery walks every wheel in
site-packages. By the time you serve your first request, the runtime has touched ~90% of the image. -
One layer is dramatically bigger than the others. The weights layer is 50–100× the size of any other layer. Anything that parallelizes "across layers" is going to leave most of its workers idle while one worker drags through the giant.
These are the constraints that broke our intuitions. Optimizations that work for normal containers — lazy loading, aggressive compression, default chunk sizes — either don't help or actively hurt large ML images.
The mental model: three phases
A container start has three sequential, blocking phases:
- Pull — fetch every layer from the registry over HTTP, decompress, write to disk.
- Create — stitch layers together with
overlayfs, set up network namespaces, configure cgroups. - Run —
entrypointexecutes; your app loads weights, opens its port, becomes ready.
Pull dominates almost every cold start you've ever waited for. The whole game is breaking the assumption that pull → create → run is strictly sequential, and finding which phase your bytes are actually moving through.
Setup
Workloads — two real images:
- Llama-3.2 1B GGUF (~2.4 GB) — quantized model + FastAPI server. The "small but real" case.
- GPT-OSS 20B (~13 GB) — same shape, much larger. The case most teams actually have in production.
Hardware — AWS m6in.2xlarge: 8 vCPU (Xeon 8375C), 32 GiB RAM, up to 40 Gbps network, EBS gp3 default volume. Picked for network headroom. (The network was the bottleneck repeatedly anyway, for reasons that had nothing to do with the NIC.)
Metric — end-to-end time from docker run to the FastAPI endpoint returning a 200 on /healthz. Not "image downloaded." Not "container created." Ready to serve.
Baseline — stock containerd with the default overlayfs snapshotter. Standard OCI images. No tuning.
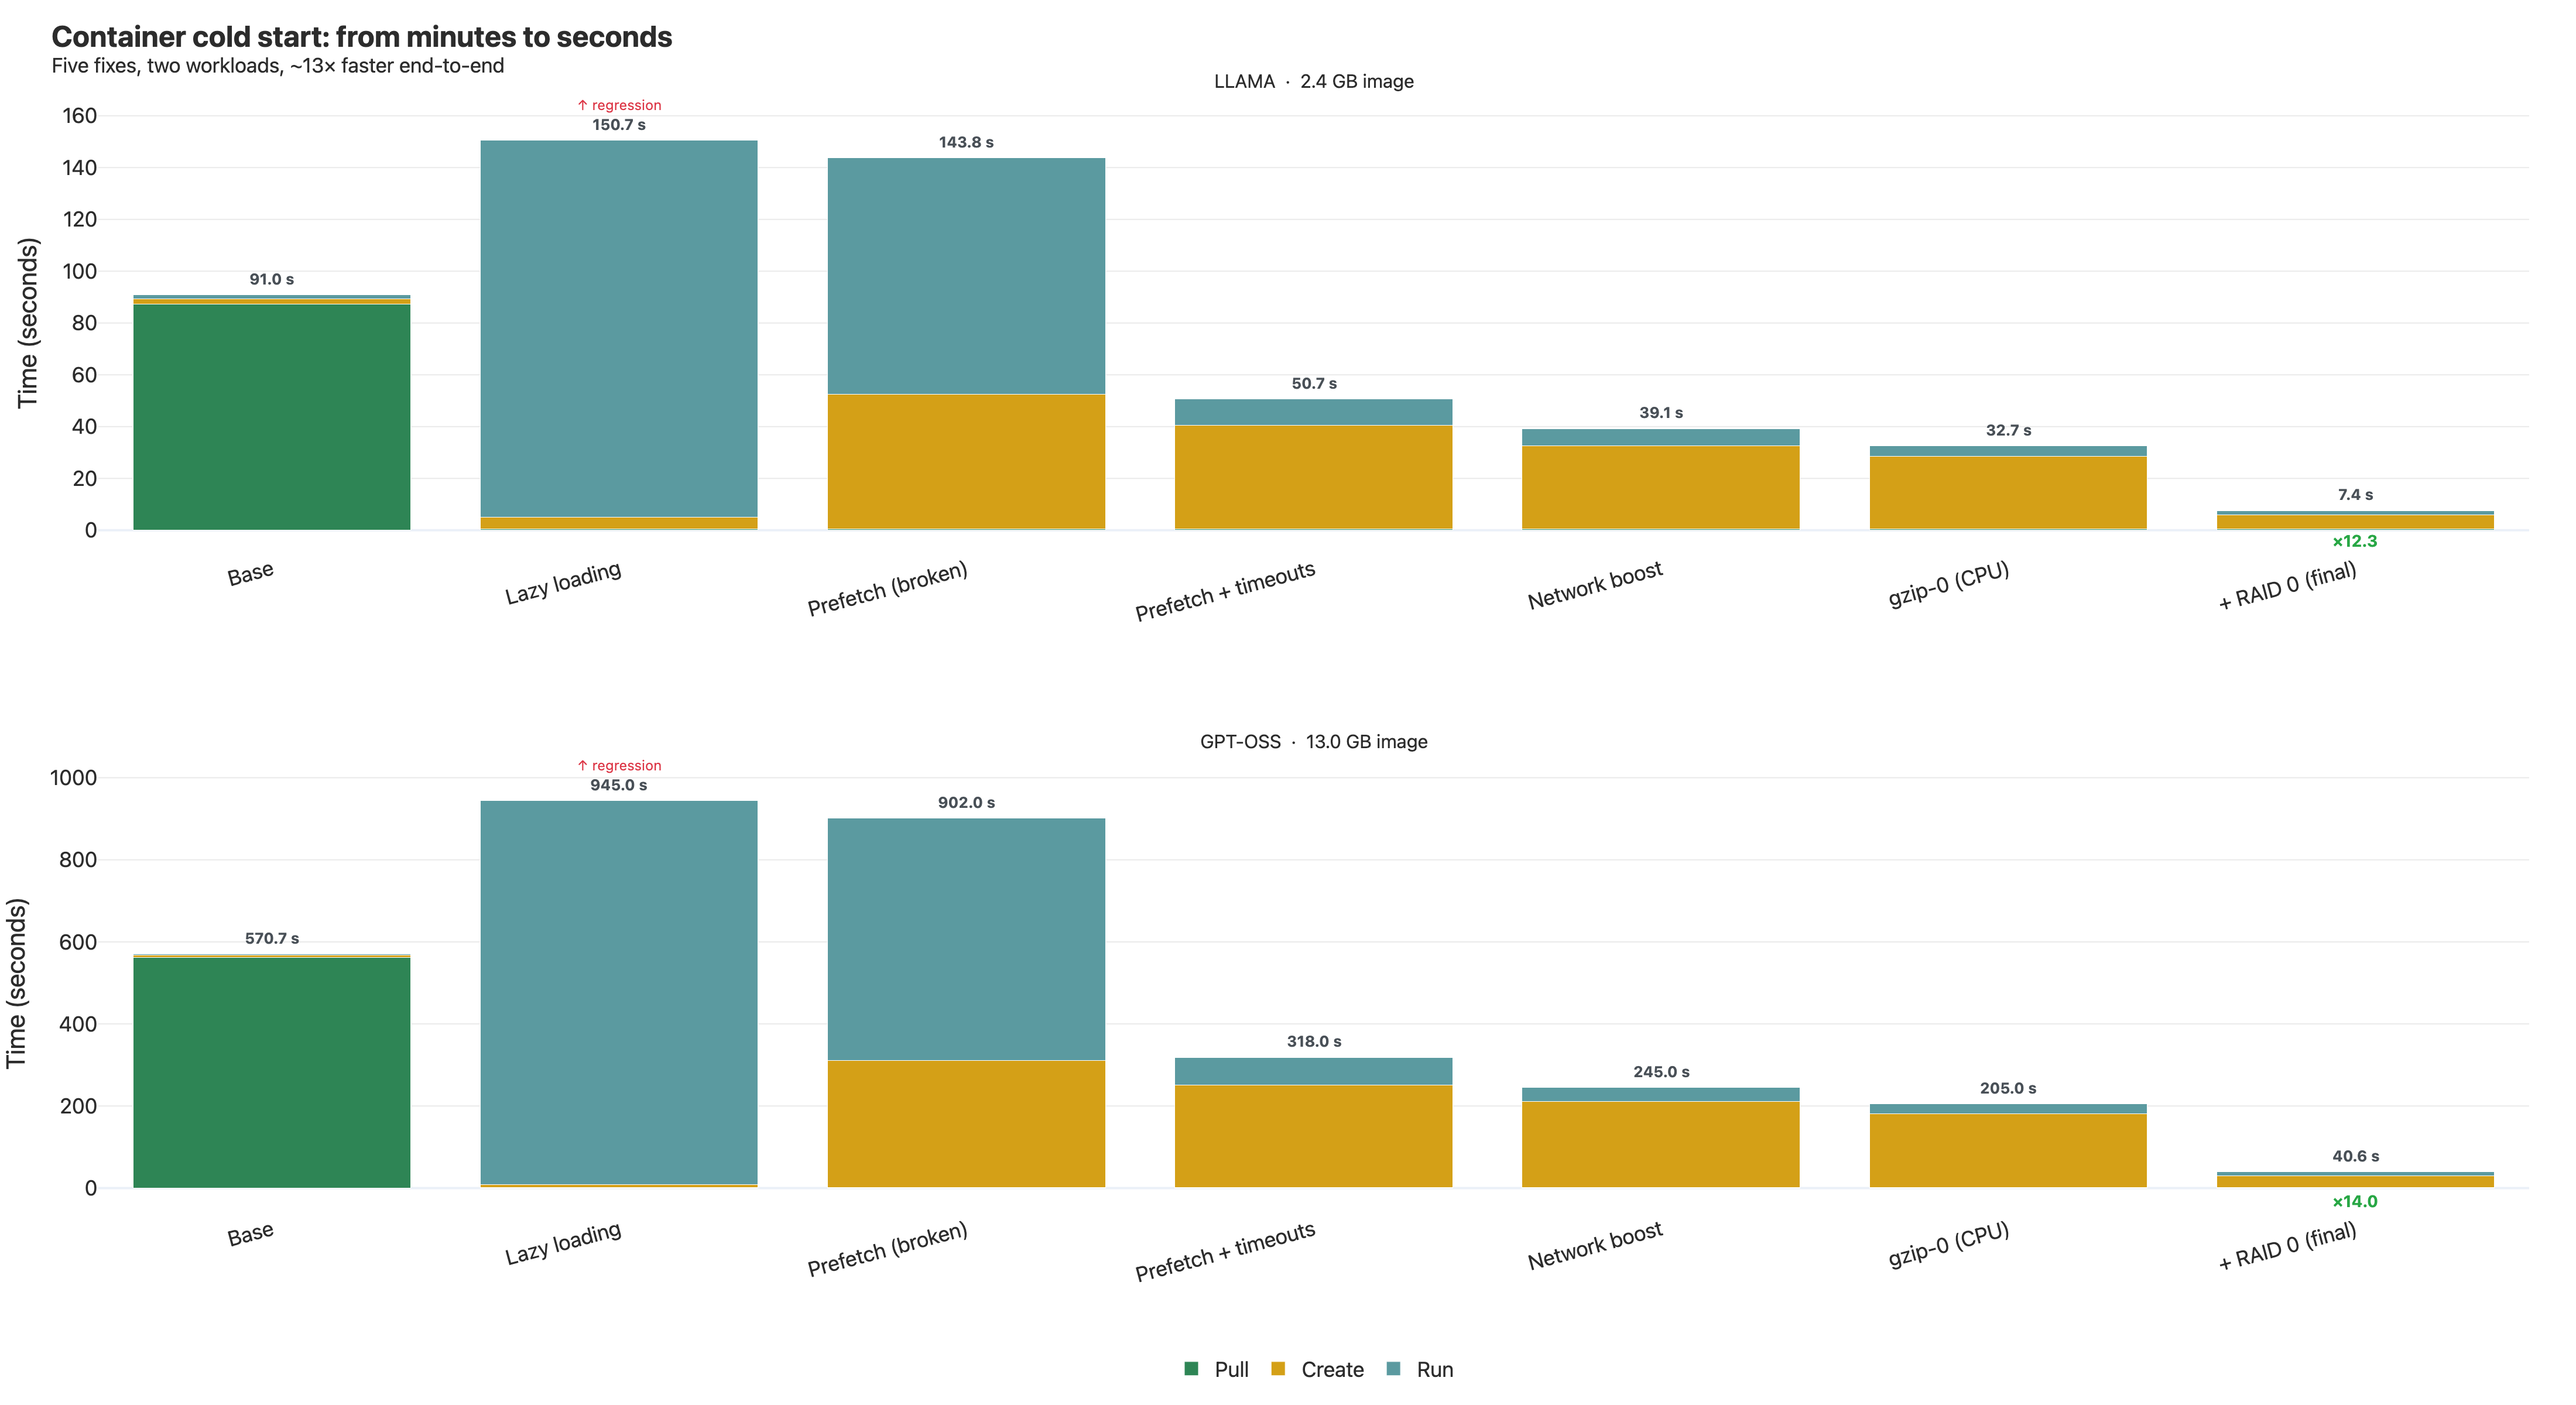
Result:
| Workload | Baseline | Final | Speedup |
|---|---|---|---|
| Llama 3.2 1B (2.4 GB) | 91.0 s | 7.4 s | ×12.3 |
| GPT-OSS 20B (13 GB) | 570.7 s | 40.65 s | ×14.0 |
Bottleneck 1 — Lazy loading made it 66% slower
If pull is the bottleneck, the obvious fix is to skip it. Mount the image as a virtual filesystem backed by FUSE; fetch bytes on demand from the registry as the running process reads them. The container starts almost immediately. AWS Fargate uses this in production via their SOCI snapshotter.
We tried it with estargz from containerd/stargz-snapshotter. We picked estargz over SOCI because an estargz image is still a valid OCI image — a runtime without the snapshotter pulls it normally. No two-artifact maintenance.
On a sanity-check MySQL image, lazy loading was a clean win: pull phase vanished, run phase grew slightly, total time dropped. That's the textbook case — MySQL ignores most of its image at startup.
Then we ran it on GPT-OSS-20B.
571s → 945s. 66% slower.
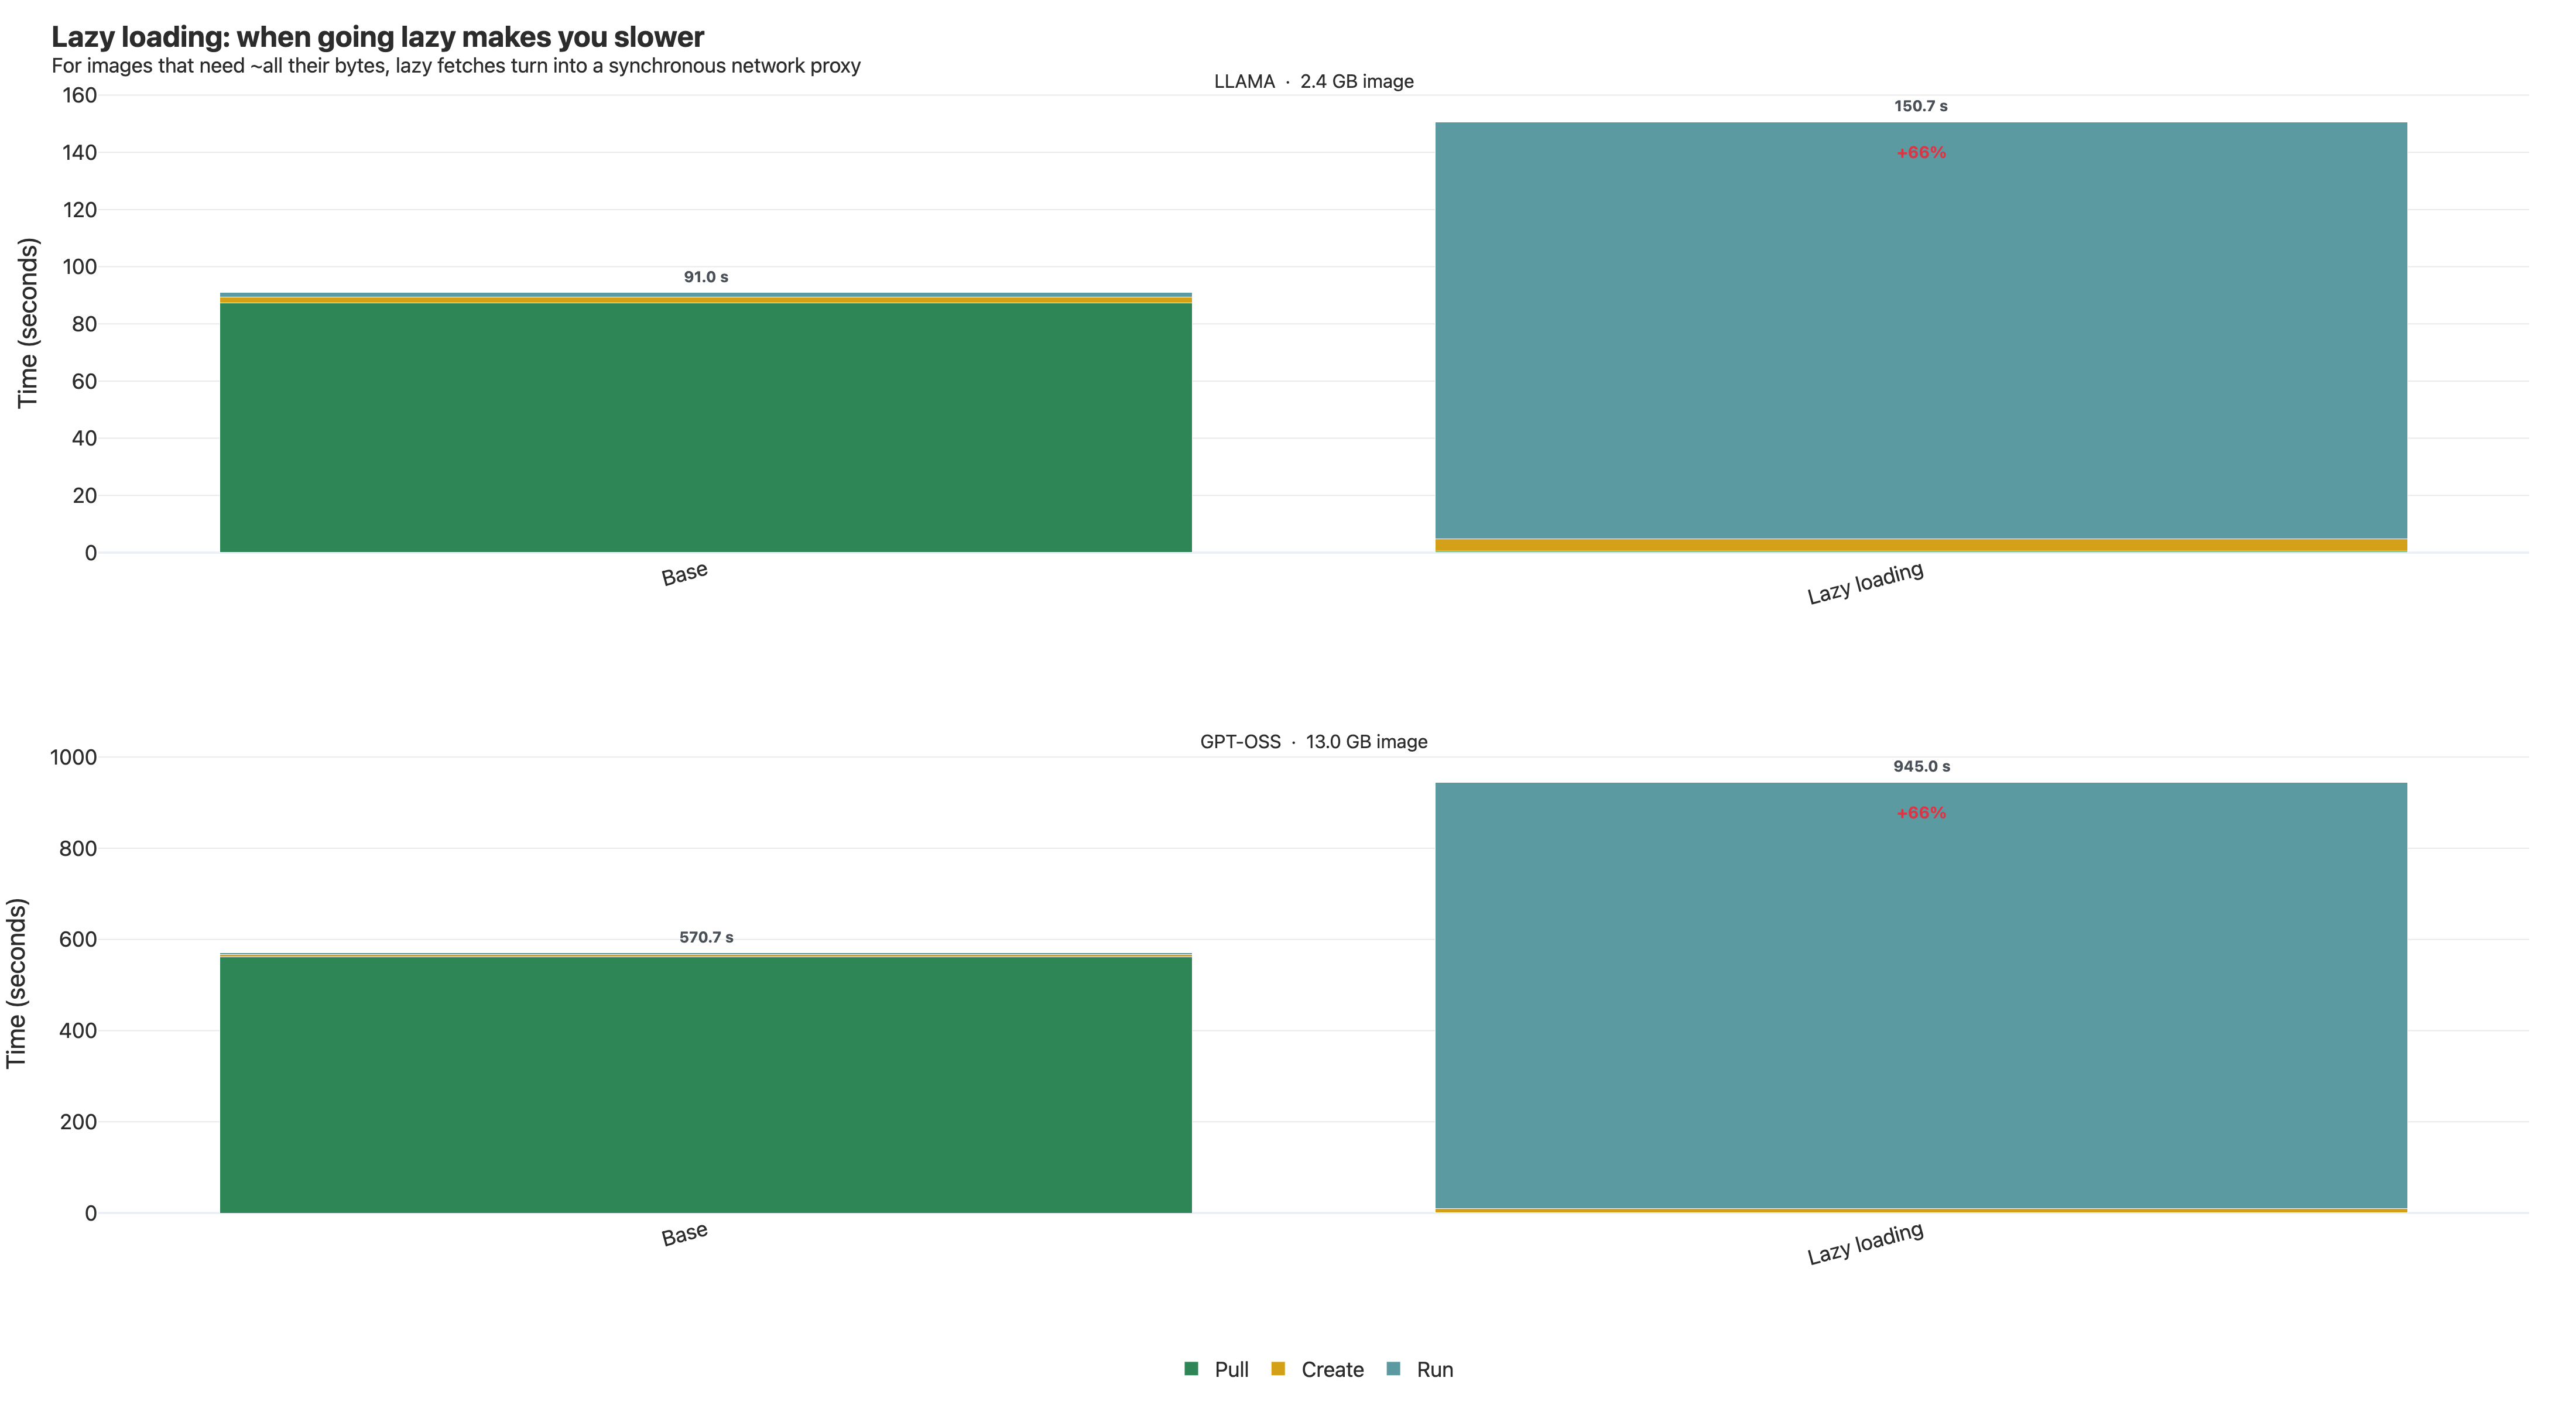
Three things stacked to make this happen:
1. LLM images need almost all their bytes. Model weights have to be in memory. Python's import machinery walks every wheel. We instrumented FUSE: ~90% of image bytes were fetched during the run phase anyway. We hadn't reduced the work — we'd moved it.
2. FUSE turns a streaming download into thousands of synchronous syscalls. Traditional docker pull opens HTTP connections per layer and streams at full bandwidth. FUSE can't. When the app calls read(fd, buf, 4096), the kernel routes to the FUSE userspace daemon, which on cache miss issues an HTTP range request, waits, decompresses, and only then returns. The read() blocks the whole time.
| Traditional pull | Lazy load (FUSE) | |
|---|---|---|
| Bytes-per-fetch | Whole layer (often 100s of MB) | One chunk (~50 KB default) |
| Concurrency | Per-layer, no app coupling | Bounded by app's outstanding reads |
| Decompression | Streaming, overlapped with download | Per-chunk, in the read path |
| Syscall semantics | Background | Synchronous, app waits inside read() |
3. Python's import storm. Every import does open() + stat() + read() across multiple candidate paths. Process startup is tens of thousands of those. Add a 5–20 ms HTTP round-trip on every cache miss and the runtime spends most of its life waiting on the network — sequentially.
Lazy loading wins when most of the image is unused. For LLM images — where you read ~all the bytes — it just trades one big sequential download for thousands of small synchronous ones, plus FUSE overhead.
We needed lazy loading's image format without lazy loading's per-read latency. estargz has the feature for this: prefetching.
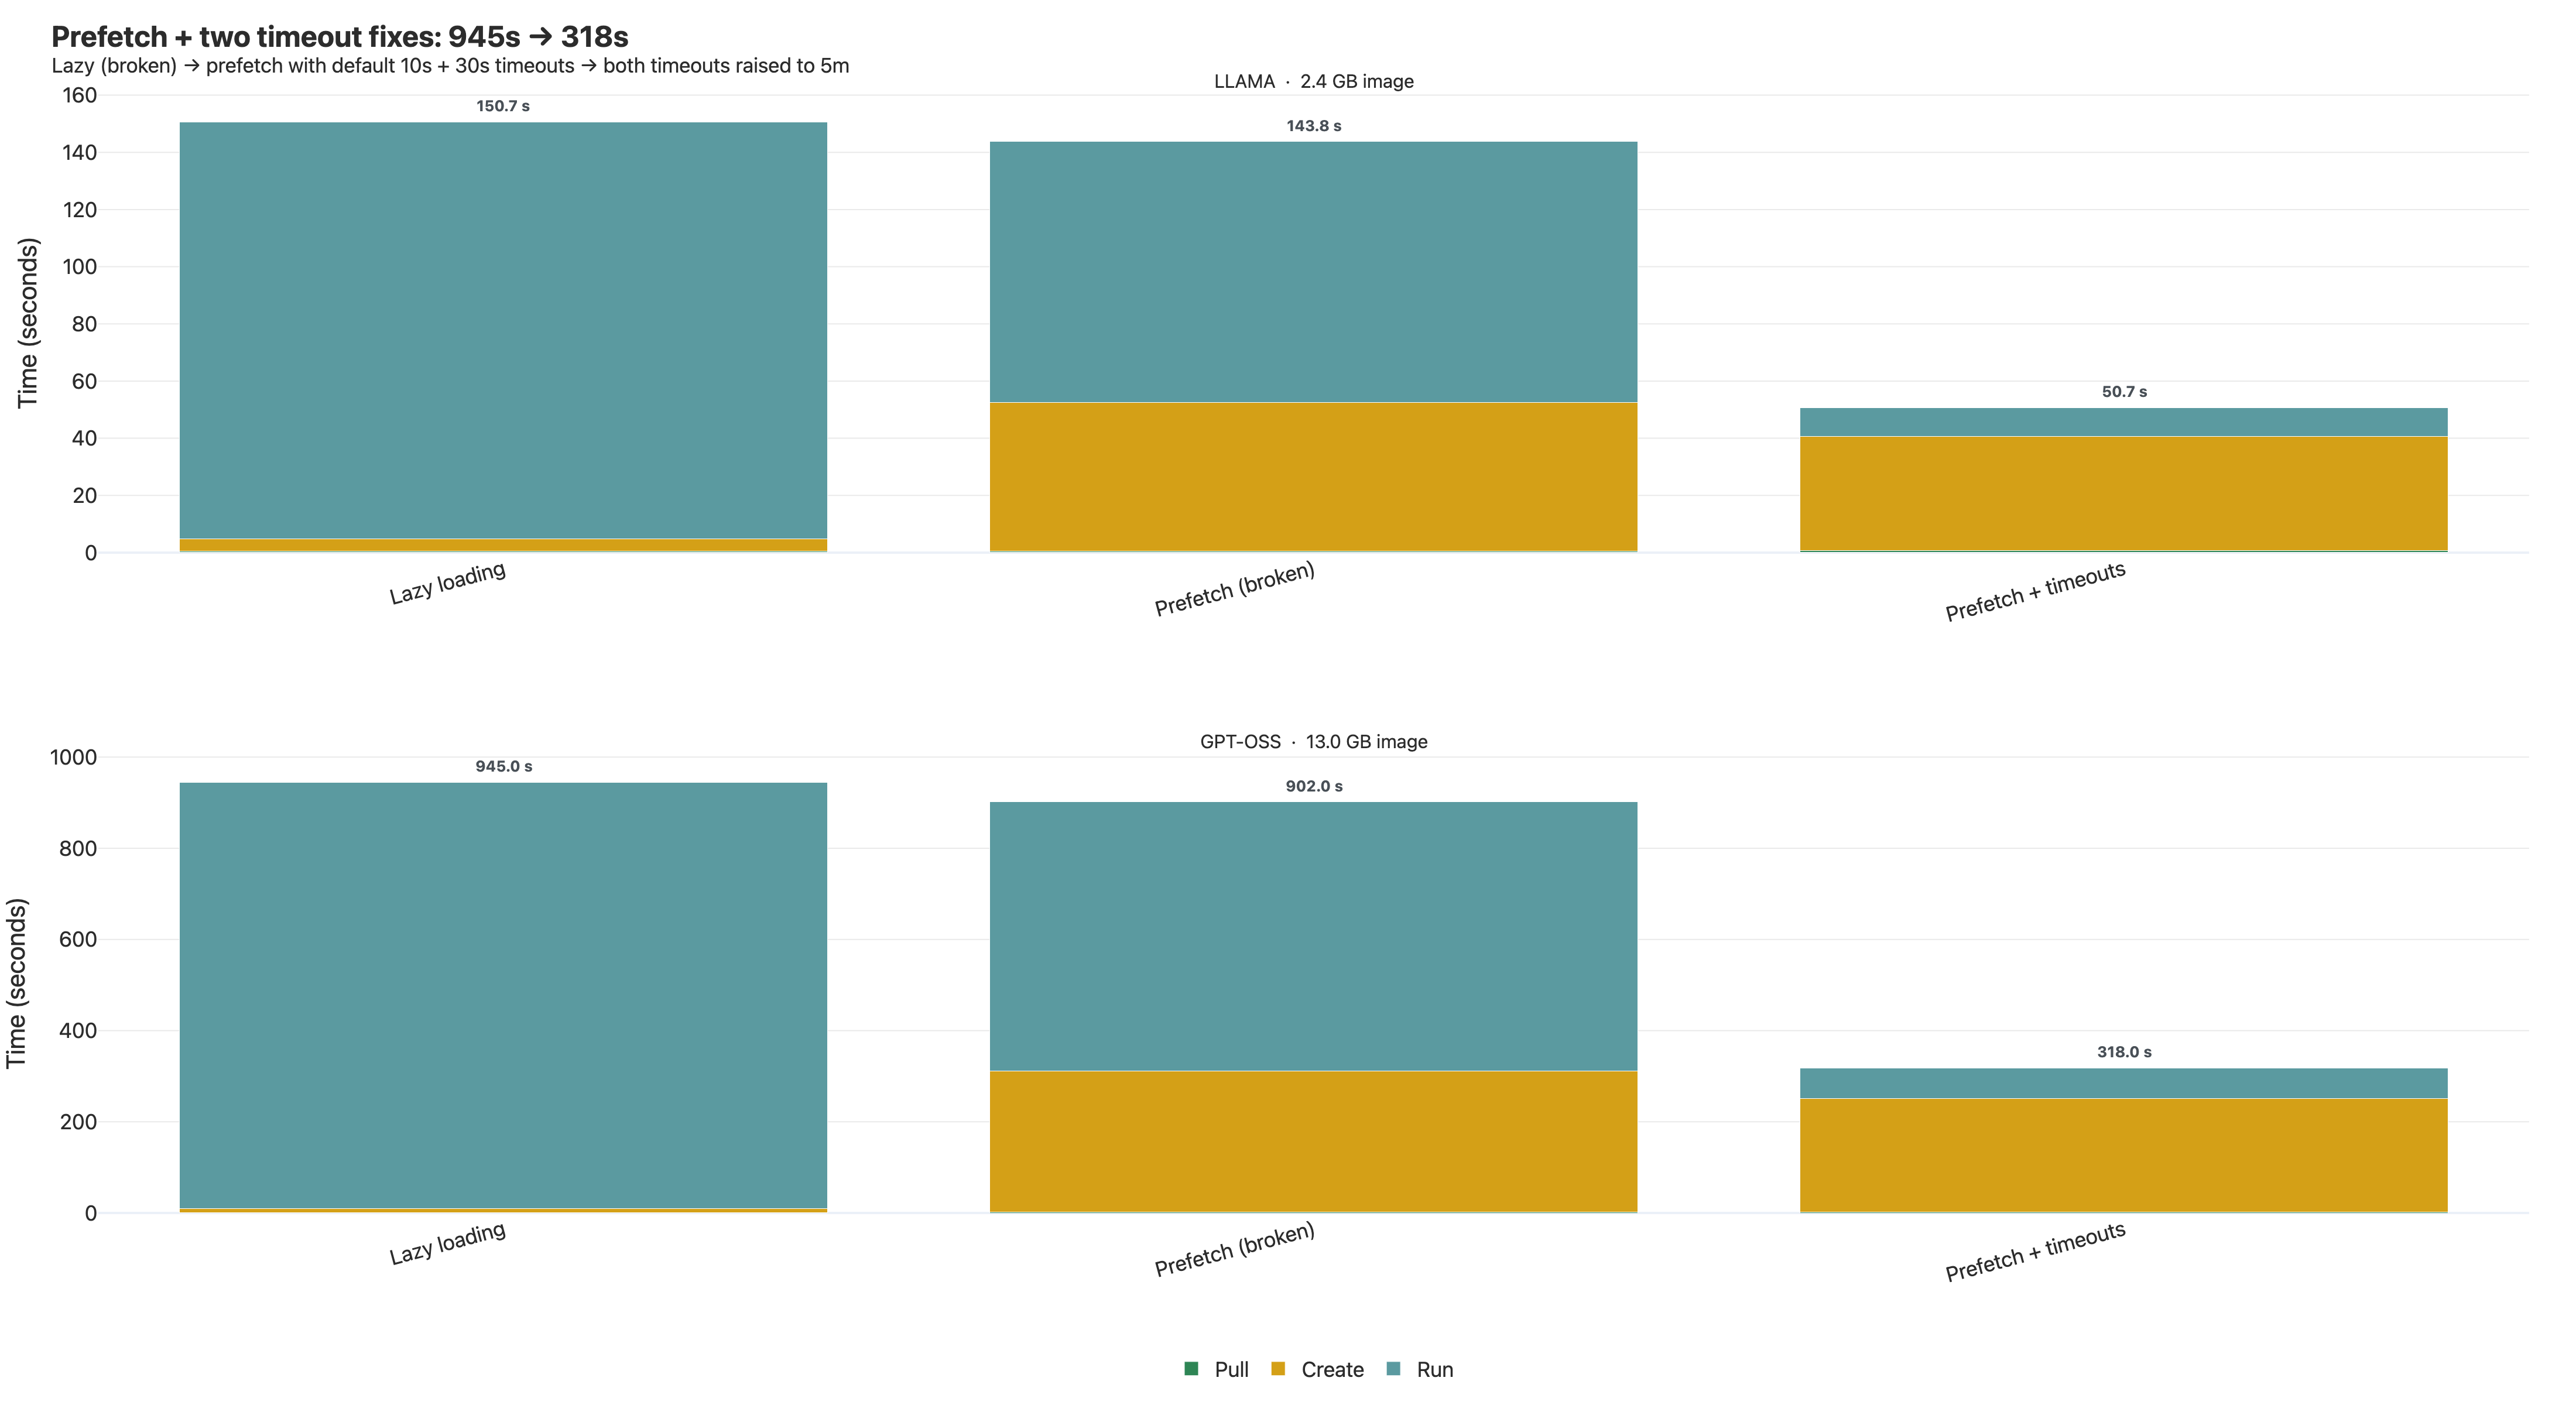
Bottleneck 2 — Prefetch, and three nested timeouts
When you build an estargz image, you run it once on a representative workload and record which files it touches at startup. Those get marked as "prefetch landmark" entries in the layer index. At runtime, the snapshotter eagerly fetches all marked files in parallel via HTTP range requests, before the app starts issuing reads.
So the run phase, instead of thousands of blocking 50 KB fetches, starts with most of its bytes already cached.
That's the theory. In practice, the first run printed this for every layer:
failed to prefetch layer sha256:9f3a... :
context deadline exceeded
The container started anyway — the snapshotter falls back to lazy reads on prefetch failure — but total cold start landed at 902s (vs. 945 for pure lazy). We got the slowness without the speedup.
Timeout #1: prefetch_timeout (default 10s)
The first timeout you find in the docs. Prefetch is best-effort; give up if it can't finish in 10 seconds. For a 13 GB image with a prefetch list covering ~90% of the bytes, 10 seconds is absurd. We bumped it to 5 minutes.
# /etc/containerd-stargz-grpc/config.toml
[prefetch]
  prefetch_timeout = "5m"
Restarted. Re-ran. Same error. Same caller.
Timeout #2: the HTTP fetcher's own deadline (default 30s)
This is where reading the source mattered more than reading the docs.
The snapshotter wraps each HTTP range request in its own context.WithTimeout, defaulting to 30 seconds, set independently of prefetch_timeout. So:
prefetch_timeoutbudgets the whole prefetch operation across all marked files.- The HTTP fetch timeout budgets one range request.
At our chunk sizes, the big files took longer than 30 seconds per range request. The inner timeout cancelled them and logged the exact same context deadline exceeded string as the outer would have. From the logs, you can't tell which deadline killed you. We were fixing the wrong knob for an afternoon.
The actual key (in our snapshotter version) was on the resolver config. Bumped to 5 minutes. Error stopped. Prefetch finished.
That alone took GPT-OSS from 902s to roughly 450s.
Timeout #3: the 30-second create-phase ceiling
We were beating the baseline, but not by as much as the math said. Watching the timing breakdown, the create phase had grown to dominate — and seemed to plateau around 30 seconds regardless of prefetch progress.
The snapshotter has another deadline that gates how long prefetch is allowed to run inside the container's create phase. Independent of the two HTTP-level timeouts. Anything not prefetched by then gets abandoned and falls back to lazy reads at runtime.
Once we raised that internal deadline alongside the other two, prefetch could actually run to completion inside the create window. Create grew (legitimately, now doing real work) and run shrank by much more.
GPT-OSS dropped from ~450s to 318s. First time we comfortably beat vanilla docker pull.
Two general lessons:
When you tune a "timeout," check whether it's a per-operation, per-attempt, or parent-context timeout. Long operations over HTTP almost always have nested deadlines. If the symptom doesn't change after the config edit, you're tuning the wrong layer.
Read the source. The snapshotter is a few thousand lines of Go. Grepping for
context.WithTimeoutin the prefetch path found timeout #2 in fifteen minutes. The cost of trusting the config doc was an afternoon of misdirected edits.
We were still using less than 3% of the available network bandwidth.
Bottleneck 3 — Network: chunk size and a free win for big layers
The default chunk size in estargz is 50 KB. That's the right call for lazy reads — fetch-as-little-as-possible when you don't know what's coming next.
Apply that default to prefetch, where we already know which bytes we want, and you've architected a throughput cap. Each 50 KB range request carries HTTP overhead (TCP, TLS, headers, server-side seek) at a few ms per round trip. The math:
(50 KB / 3 ms) ≈ 17 MB/s per outstanding request
Even on infinite bandwidth. The snapshotter parallelizes, but with 50 KB chunks we're paying HTTP overhead per kilobyte. That's why prefetch saturated around 1 Gbps — not network saturation, syscall-and-roundtrip saturation.
The fix: two chunk sizes for two different jobs
The snapshotter exposes two chunk-size knobs:
[blob]
  chunk_size = "50KB"   # lazy reads — leave it

[prefetch]
  chunk_size = "32MB"   # bulk-fetch where we already know we want it all
Lazy reads should be conservative. Prefetch should be aggressive. Same filesystem, two policies. Right separation of concerns.
We also bumped max_cache_fds from 10 to 100. The snapshotter keeps file descriptors open for cached chunks; on a many-layer image, 10 was nowhere near enough. The cache was constantly closing and reopening files, serializing reads behind FD churn.
[fs]
  max_cache_fds = 100
If you go above 100, check ulimit -n for the snapshotter process — the error message you'll see otherwise is "too many open files," which is very hard to trace back to this setting.
Combined: peak inbound hit ~9 Gbps during the burst, sustained 4–8 Gbps for most of prefetch. Roughly 9× the previous peak. GPT-OSS: 318s → 245s.
The free win that matters specifically for LLM images
Vanilla docker pull parallelizes across layers. Worker N gets layer N. If your image has one giant layer and a bunch of small ones — exactly what an LLM image looks like, with the model weights as one fat blob — most workers finish quickly and sit idle while one worker drags through the giant. The slow lane sets the pace.
estargz prefetch parallelizes per byte-range, with a worker pool that steals work from any layer's range list. When a worker finishes a small layer, it grabs the next pending range from whichever layer still has bytes outstanding — including the giant model-weights layer.
This is work-stealing parallelism. Same idea as make -j on an uneven build graph. For images shaped like LLM containers, a properly-tuned estargz pull is faster than vanilla docker pull even before you count the lazy-loading wins. We re-measured to make sure; the result holds. It's an emergent property of the design.
If you want one slide to justify estargz to your platform team for ML workloads, this is it.
Bottleneck 4 — CPU pegged, and why gzip -0 made it faster
When prefetch was running flat out at 8–9 Gbps, every vCPU pegged. >90% on all eight cores during the burst. Past the burst, CPU dropped and so did throughput — the two are coupled, because every chunk has to decompress before the next batch can land.
CPU saturation on a network-fetch workload is actually good news. It means the pipe is full; the work to consume the pipe is now the limit. Network capacity is fixed (you've already paid for the instance). CPU work, you can usually reduce.
The CPU was burning in one place: gzip decompression.
Why parallel decompression even works in estargz
A regular OCI layer is a single tar piped through gzip. gzip is a streaming format. To decompress byte N you need the dictionary state from bytes 0 to N−1. You can't start in the middle. You can't split it across cores. The whole layer is one serial pipeline, capped at ~200–400 MB/s on modern CPUs no matter how many cores you have.
This is why for big layers — like an LLM weights layer — vanilla docker pull leaves most of your CPU idle even when it's the bottleneck.
estargz fixes this. It splits each file into segments of at most 4 MiB, each gzip-compressed independently with its own dictionary state. Concatenated, it's still a valid gzip stream (so non-estargz tools can pull the image normally). But for tools that read the index, those 4 MiB segments are independent — each can be decompressed on its own core in parallel, with no shared state.
A 1 GB layer that vanilla gzip would chew through serially gets split across all 8 vCPUs.
This is the only reason CPU was reachable as a bottleneck at all. Without it, decompression caps out at one core and the network never gets close to 9 Gbps.
The counterintuitive fix: ship layers uncompressed
Conventional wisdom says compress hard. Disk space is cheap, you build once, ship to many, smaller is faster. Most pipelines use gzip -9.
We rebuilt our estargz images with gzip -0. Compression level zero. The bytes go in, the bytes come out, gzip just adds framing.
This sounds wrong. Bigger on the wire. More bytes to write. By every received intuition this should be slower.
It was dramatically faster. CPU dropped to under 30% during the burst. Network throughput stayed the same. GPT-OSS: 245s → 205s.
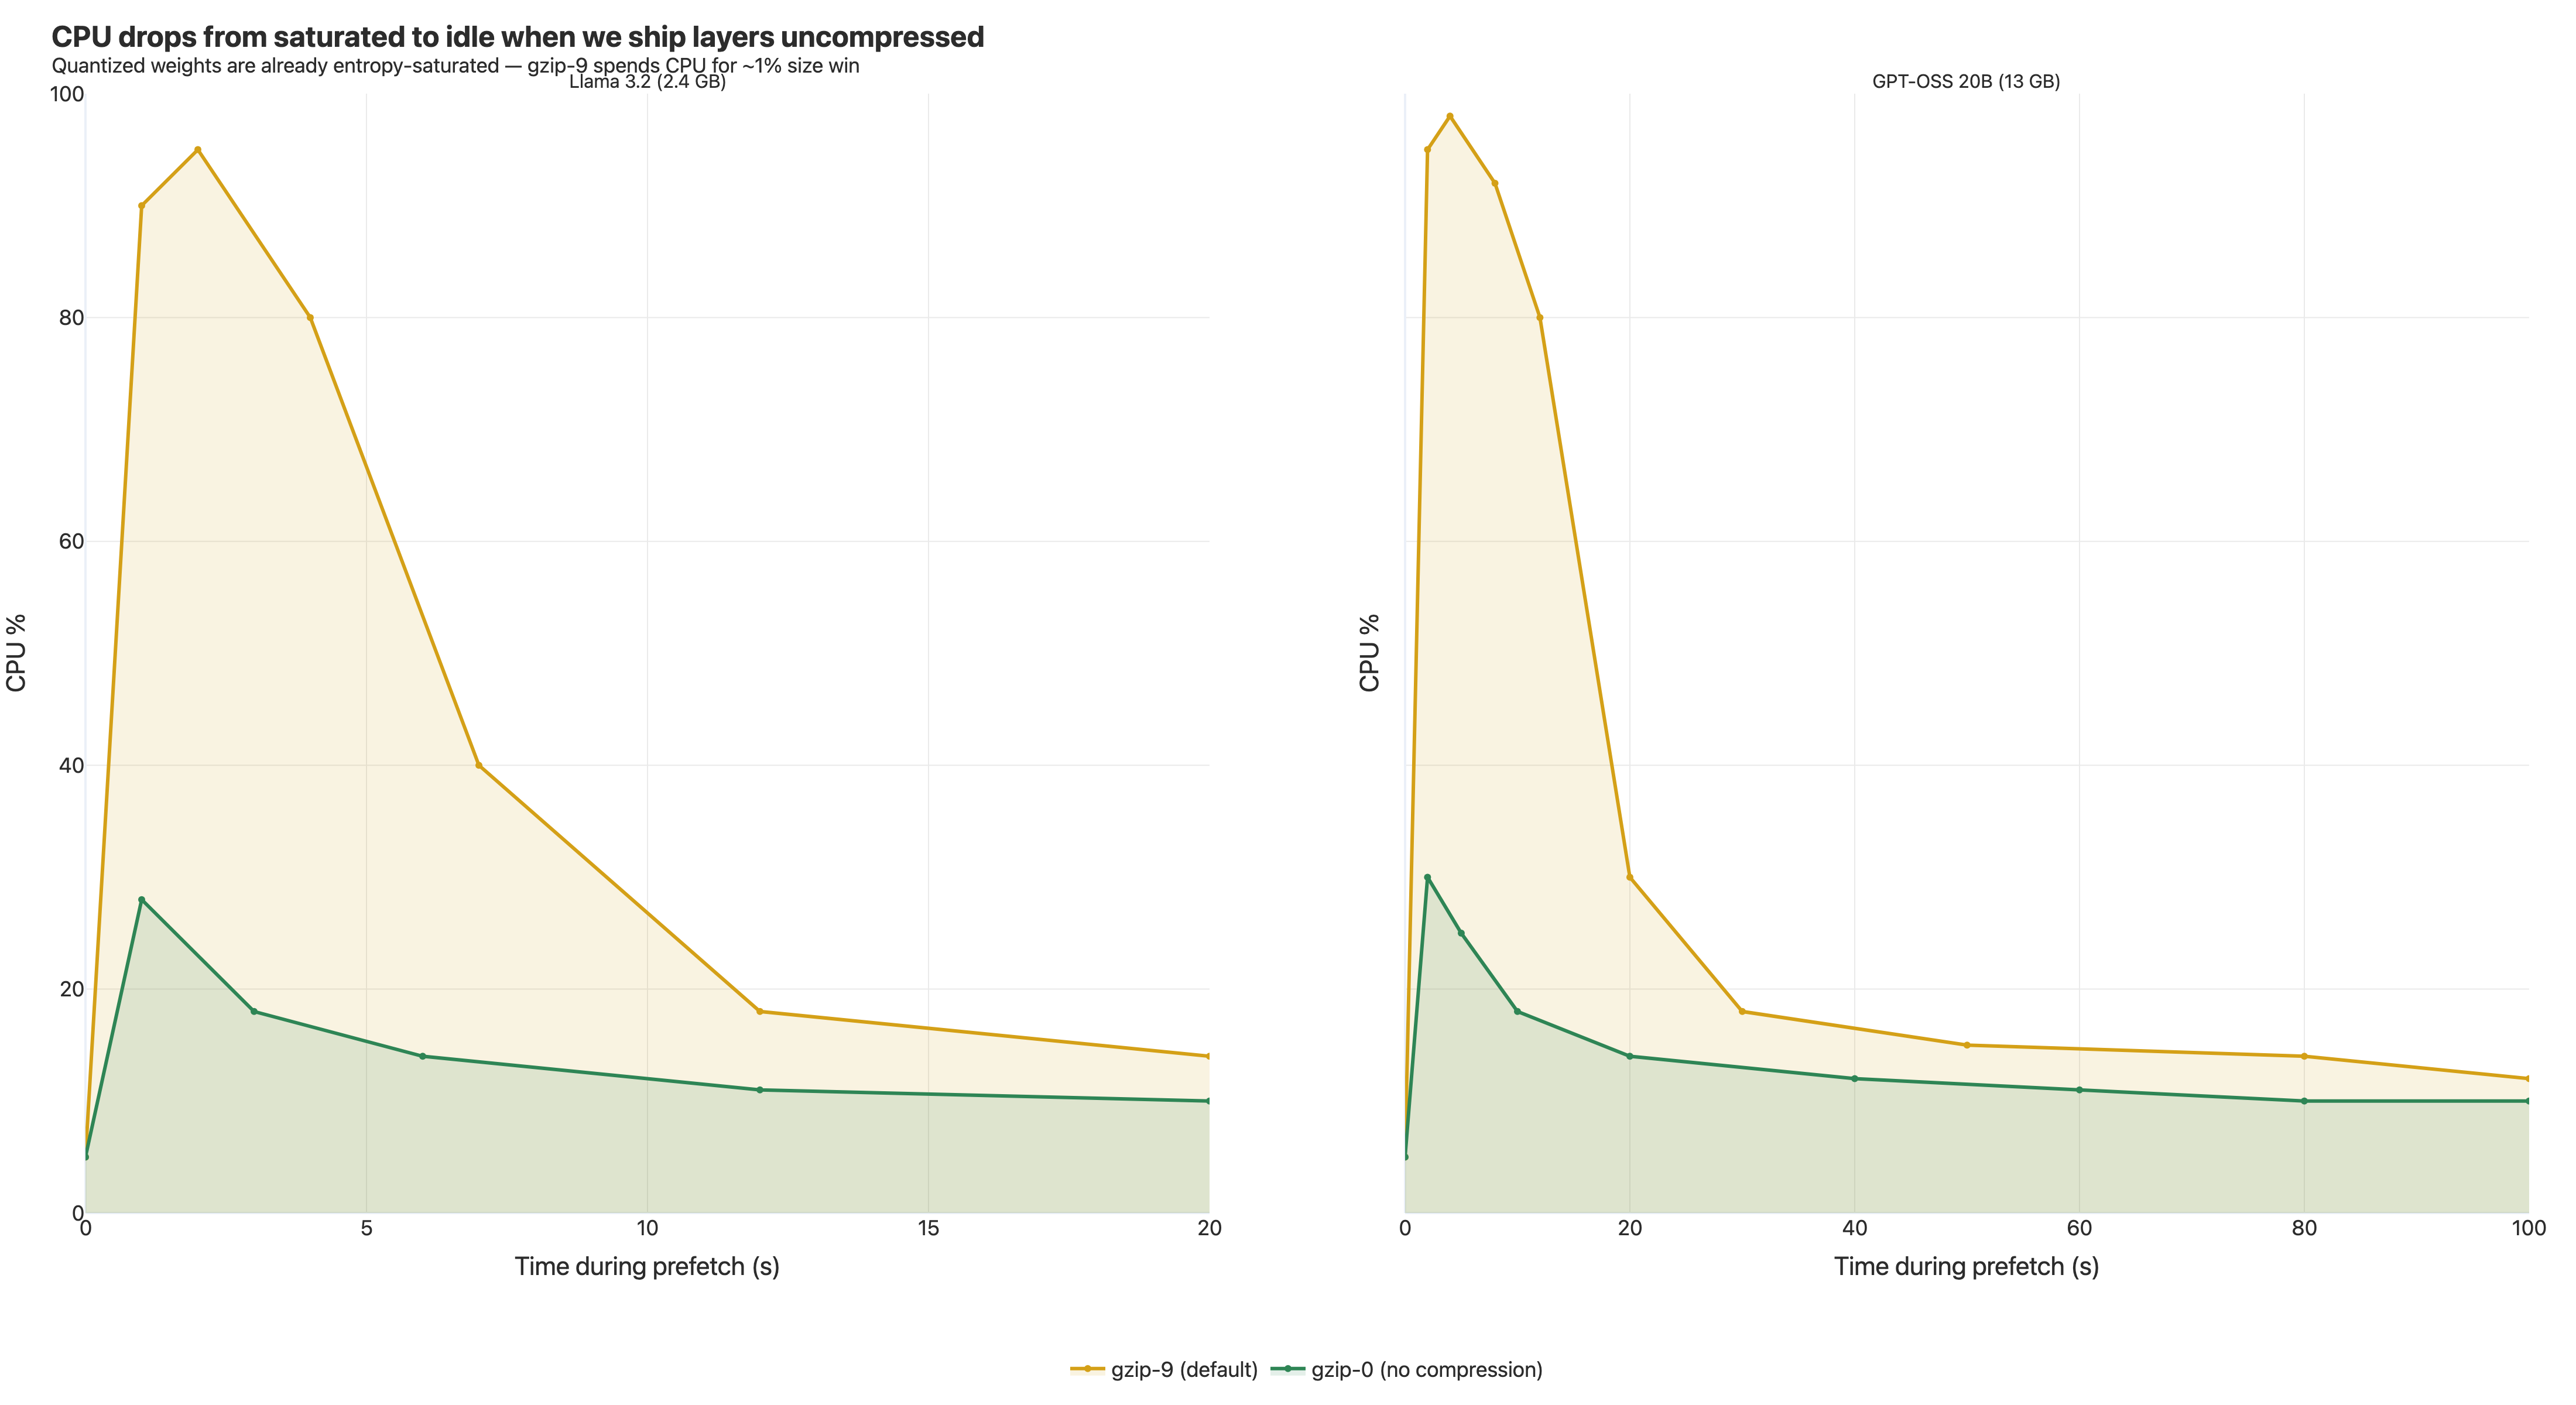
Why it's safe for LLM images specifically
Quantized model weights are dense, high-entropy, float-derived data. They are the worst-case input for a general-purpose compressor. On our weights blob, the difference between gzip -9 and gzip -0 was 1–2%. Spending seconds of CPU per layer to save 1% of bytes is a bad trade when those bytes are already moving at multi-gigabit speeds.
Same property holds for any payload that's already entropy-saturated:
- Already-compressed media (mp4, jpeg, webp).
- Quantized ML weights (most modern LLM checkpoints).
- Encrypted blobs.
- Pre-compressed bundles (gzipped JS, brotli'd assets).
For the rest of an LLM image — Python interpreter, wheels, application code — gzip -0 does cost real bytes. Those compress well. But on a 13 GB image where the weights are 90%+ of the volume, the size penalty doesn't move the needle.
The right gzip level for a layer is determined by what's in the layer, not by the compressor's defaults. If your bytes are already entropy-saturated, compression is a CPU tax with no benefit on the prefetch path.
If your image is mostly Python source and node_modules, this is not the right call. The math flips when your bytes are compressible.
One operational note: some managed registries do server-side validation or transparent re-compression. Vanilla registries handle gzip -0 fine — the wire format is still valid gzip. If you see odd behavior on a managed registry, check whether it's rewriting your layers.
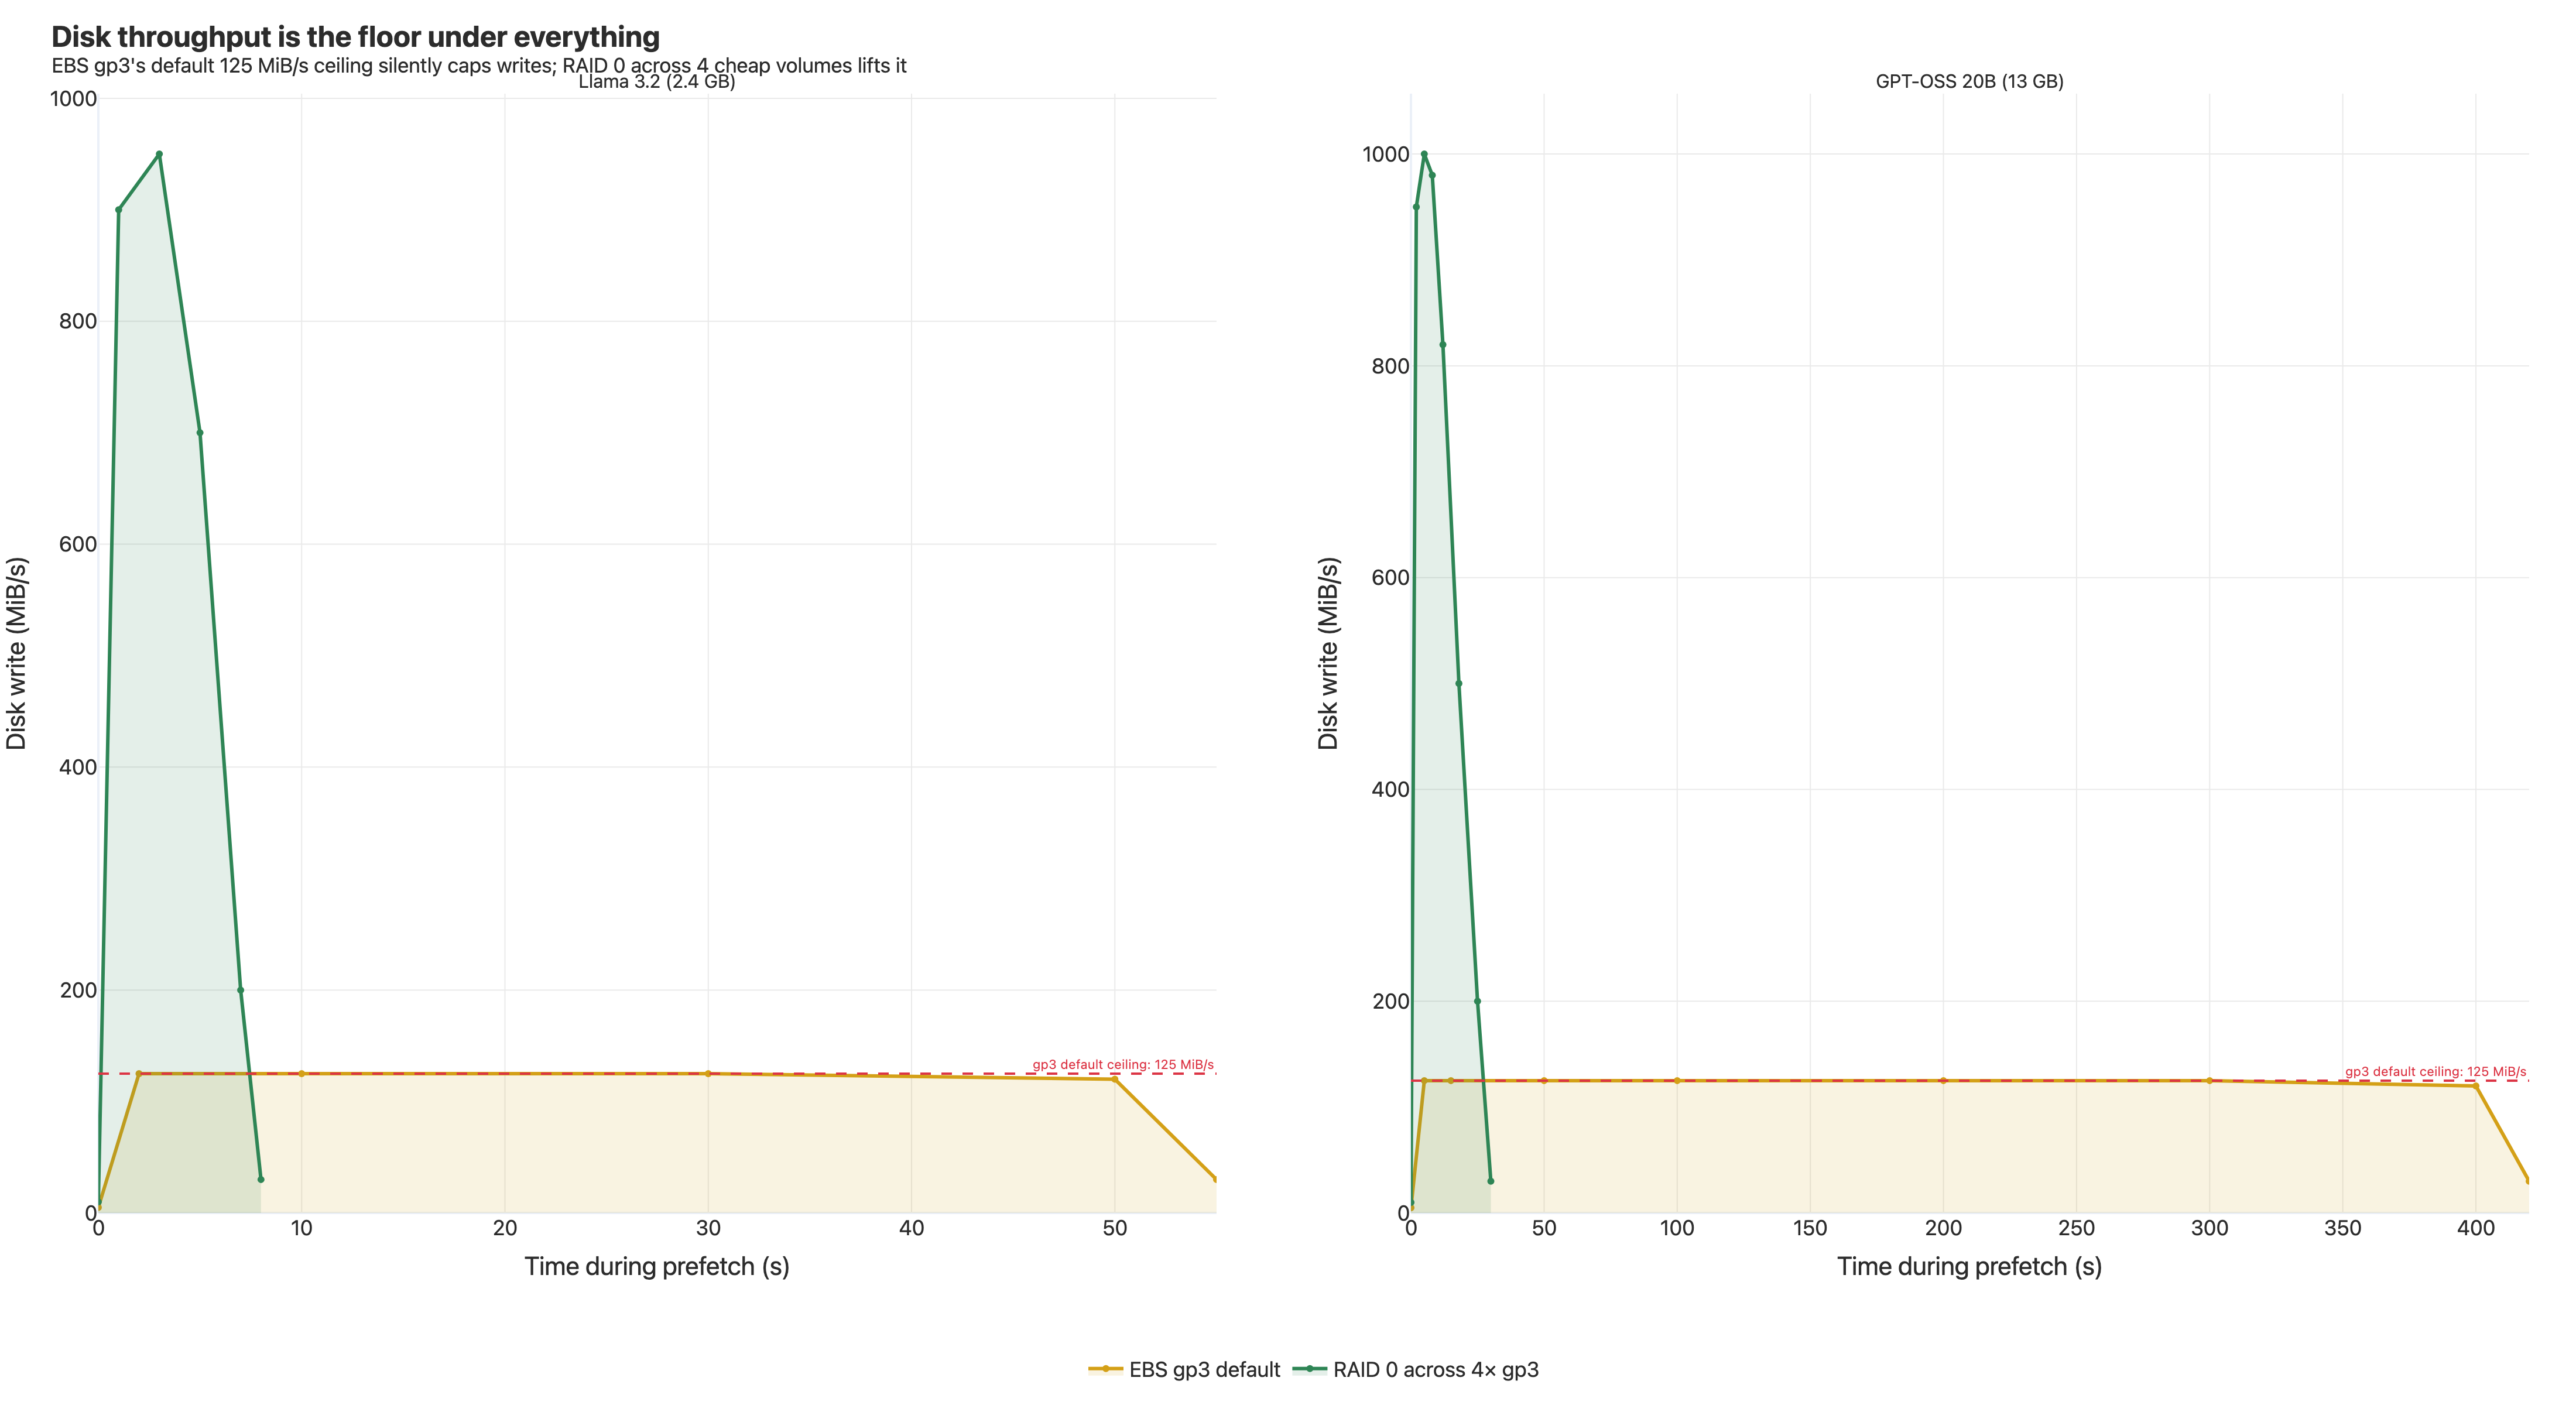
Bottleneck 5 — The disk floor nobody measured
After four fixes:
- Network: 8–9 Gbps during prefetch.
- CPU: no longer pegged.
- Synchronous lazy reads: mostly pre-empted by prefetch.
- GPT-OSS: 205 seconds (from 570.7 baseline). Real result.
But the cold start stopped getting faster, no matter what else we tuned at the snapshotter or registry layer. The network was running. CPU was idle. There was a gap between bytes arriving at the machine and bytes visible to the running container that nothing in our tracing was explaining.
We finally ran iostat. The block device's write throughput was sitting at exactly 125 MiB/s, completely flat, for the entire prefetch. Pinned. Because there was a regulator: the instance was using a default-configured AWS EBS gp3 volume, and the gp3 default write throughput is — exactly — 125 MiB/s.
Network in:  ~8 Gbps   ≈  1000 MiB/s
Disk out:    ~125 MiB/s
We were filling the pipe 8× faster than it could drain. Bytes were arriving, CPU had nothing to do, and they were sitting in memory waiting for the disk to catch up.
The bitter detail: the EBS gp3 spec lists "781 MB/s baseline, 3125 MB/s burst" right at the top. Those are the read numbers. Write throughput is a separate, lower limit. Nobody on our team had read the EBS docs closely enough.
Two fixes
Option 1 — pay AWS for more throughput. gp3 lets you provision additional throughput in the console. Reliable, supported, surcharge applies.
Option 2 — RAID 0 across multiple gp3 volumes. Each volume contributes its own 125 MiB/s baseline; stripe four of them with mdadm and you get 500 MiB/s for the cost of four cheap volumes. No throughput surcharge. We used this for benchmarking.
Tradeoffs of RAID 0:
- No redundancy. Lose any one volume, lose the array. Fine for ephemeral instances staging images from a registry — the data is reproducible. Don't do this for data you care about.
- Provisioning complexity. Script the volume creation + attachment +
mdadmsetup at instance launch. - Boot vs. data volume. Clean for the data volume hosting the snapshotter content store. The root volume is more involved; we didn't go there.
For staging a content cache, RAID 0 is a good fit. For most production setups where someone else manages the AMIs and IaC, paid gp3 throughput is simpler and not much more expensive at our volumes.
Either way, with the disk unblocked, the rest of the stack finally runs at the rate we'd been tuning for. GPT-OSS: 205s → 40.65s.
The honest caveat
The 125 MiB/s ceiling is AWS EBS gp3-specific. GCP Persistent Disk, Azure managed disks, and bare-metal NVMe each have their own throughput model. The pattern — "your storage is slower than your network" — recurs in different forms on most cloud setups. If you're optimizing this elsewhere, measure block-device write throughput first.
Everything else in this writeup — lazy loading, prefetch, chunk sizing, gzip levels — is platform-agnostic.
The 7-step recipe
If you want the answer without the journey:
- Switch to estargz for the layer format (compatibility-preserving lazy loading).
- Build with a prefetch landmark recorded against a representative startup workload.
- Bump every prefetch deadline — the operation-level
prefetch_timeout, the per-HTTP-requestfetch_timeout, and the snapshotter's internal create-phase deadlines that gate how long prefetch is allowed to run before the container moves on. - Set
prefetch:chunk_sizeto something much larger than the defaultblob:chunk_size(32 MB worked for us; default is 50 KB). - Raise
max_cache_fdsto 100, with a correspondingnofileulimit. - Build estargz layers at gzip level 0 — at least for the layers dominated by high-entropy data like quantized model weights.
- Stop being disk-bound: provision EBS gp3 throughput, or RAID 0 across multiple gp3 volumes.
The config, in one place
Pasting all the snapshotter knobs together for copy-pasting. Field names follow the upstream containerd-stargz-grpc config schema; check the reference config for your version since key paths have shifted across releases.
# /etc/containerd-stargz-grpc/config.toml

# Prefetch operation budget (default: 10s — far too short for big images)
[prefetch]
  prefetch_timeout = "5m"
  chunk_size       = "32MB"   # bulk-fetch in prefetch (default 50KB is for lazy reads)

# Per-HTTP-request budget (default: 30s — kills big-file fetches with the
# same "context deadline exceeded" error as prefetch_timeout above).
# Exact field name has moved across snapshotter releases; in our build it
# was on the resolver config. Look for context.WithTimeout in the prefetch
# path if grep doesn't find it.
[resolver]
  fetch_timeout = "5m"

# Lazy-read chunk size — leave at default; conservative is correct here
[blob]
  chunk_size = "50KB"

# Cache FDs (default 10 is too low for many-layer images)
[fs]
  max_cache_fds = 100
And on the build side, the gzip level you want is set at estargz-conversion time. With the ctr-remote tooling that ships with stargz-snapshotter:
# Convert an existing OCI image to estargz with no compression.
# Right call for layers dominated by high-entropy data (model weights,
# already-compressed media). Wrong call for source-code-heavy layers.
ctr-remote image optimize \
  --estargz-compression-level 0 \
  --record-out=prefetch.list \
  registry.example/myimage:base \
  registry.example/myimage:estargz
Don't take these values as universal — they're tuned for a 13 GB LLM image on AWS m6in.2xlarge. If you're shipping mostly Python source, gzip -0 will cost you real bytes; if you're on a smaller instance, max_cache_fds = 100 may need an ulimit -n bump first. The prefetch_timeout and fetch_timeout values just need to be larger than your slowest layer's expected fetch time.
What's left: the runtime-load frontier
The image-format layer can do a lot, but not everything. There's a final phase no amount of estargz tuning speeds up: the application's own work after the bytes are present. For an LLM container, that means loading weights into memory, allocating GPU buffers, warming caches, building tokenizers. That happens after read() calls have already been served.
Optimizing that lives at the application and runtime layer. Options range from process snapshotting (CRIU, runc-checkpoint, vendor mechanisms) to streaming weights directly into GPU memory while the image is still pulling. Both are interesting, both are research-y in different ways, both deserve their own writeups.
This work ends where the image format runs out of room.
Credit
None of this is possible without the upstream projects:
- containerd/stargz-snapshotter — the estargz format and the snapshotter we tuned.
- awslabs/soci-snapshotter — AWS's alternative, with great production-lazy-loading documentation.
- opencontainers — the spec work that makes any of this portable.
- containerd — the snapshotter plugin model that lets you swap estargz in without rewriting the world.
If you're working on cold-start performance, lazy-loading filesystems, registry design, or anywhere adjacent — please reach out. We learned this the slow way and the next person shouldn't have to.
This work was done at Vertexcover, an AI-native engineering studio. We help teams running production AI workloads find and fix bottlenecks like the ones in this post. If your LLM inference platform has cold-start problems — or you just want to compare notes — we'd love to talk.